Category Archives: Transit

The Power of Intersection Density

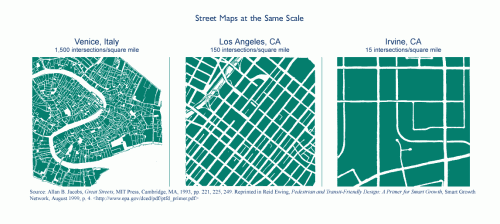
Intersection density is the number of intersections in an area. It corresponds closely to block size — the greater the intersection density

modafinil-schweiz.site/

https://deutschland-doxycycline.com

, the smaller the blocks. Small blocks make a neighborhood walkable. This diagram shows three street layouts — extremely walkable, moderately walkable, and unwalkable — with their counts of intersections per square mile:

Intersection density makes surprising news in a study by the formidable academic duo of Reid Ewing and Robert Cervero. They have published Travel and the Built Environment: A Meta-Analysis in the Summer 2010 issue of the Journal of the American Planning Association.

As the title notes, the study is a meta-analysis: a study of 50 other studies about travel and the built environment. The authors look at the results from each of the 50 studies

, and then pool all of those results into ten built environment measurements, including intersection density.

Their findings? Of all the built environment measurements, intersection density has the largest effect on walking — more than population density, distance to a store, distance to a transit stop, or jobs within one mile. Intersection density also has large effects on transit use and the amount of driving. The authors comment,

This is surprising, given the emphasis in the qualitative literature on density and diversity

, and the relatively limited attention paid to design.

In other words, intersection density is the most important factor for walking and one of the most important factors for increasing transit use and reducing miles driven, but gets relatively little attention in research and in public policy.

Read more

Towards a Functional Classification Replacement (Part Three)

Download a print version of this essay.

Part One of this essay covers the background, characteristics and drawbacks of functional classification, and evaluates some of the leading alternatives. Part Two continues by proposing a replacement, a sustainable transportation network classification, covering the block-scale and neighborhood-scale relationships. Part Three concludes by covering the city-scale relationship and the congestion-related impacts of a sustainable network.

City Scale

The ideal pattern of regional growth has been debated at least since the 19th century. In the 1960s and 70s the focus of the debate sharpened on efficiency and sustainability, and the “Compact City” was suggested to be the ideal. The Compact City redirects all growth into a single urban core, maximizing density while minimizing the consumption of farms, forests and agricultural land. It explicitly counteracted the dominant trend of decentralized suburban sprawl.

Some of the benefits of the Compact City idea have been confirmed by researchers. Cities with higher density and more compact form have much less per capita driving (Newman and Kenworthy, 1999). In existing cities, the trend of sprawling suburban growth causes an explosion in the amount of auto driving; a policy of refocusing growth, mixed use and transit in the urban core will halt that explosion and slightly reduce the amount of driving (Simmonds and Coombe, 2000).


Analysis of city-scale development patterns shows that focusing growth on high-capacity transit nodes will have the greatest CO2 reduction effect. Image credit: Eliot Allen, “Cool Spots”

Read more

Towards a Functional Classification Replacement (Part Two)

Download a print version of this essay.

Part One of this essay covers the background, characteristics and drawbacks of functional classification, and evaluates some of the leading alternatives. Part Two continues by proposing a replacement, a sustainable transportation network classification, covering the block-scale and neighborhood-scale relationships. Part Three concludes by covering the city-scale relationship and the congestion-related impacts of a sustainable network.

A sustainable network classification ideally will do several things.

  • Actively encourage sustainability (as defined previously in the sustainable transport section); do not support unsustainable network patterns and operations.
  • Be concise, easy to remember and easy to explain.
  • Address a range of scales, a range that is at least as wide as that covered by functional classification.
  • Incorporate advanced knowledge about network function and best practices in network planning.

To reach these goals, a sustainable network classification is proposed. The classification has three primary relationships, each applying to a different scale. The three scales are block scale, neighborhood scale, and city scale. This allows each relationship to focus on the factors most relevant to its scale, without unnecessarily confusing factors from different scales or combining them inappropriately.

Read more

Energy Use and Pollution of Travel Modes

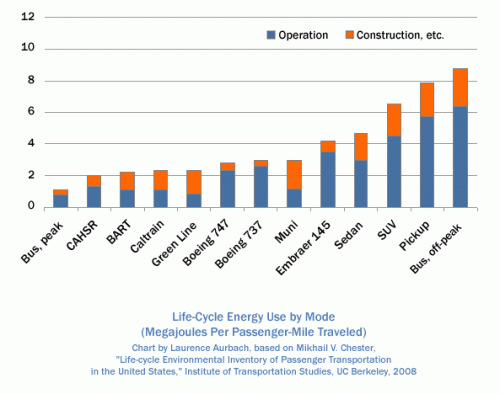
The report Life-cycle Environmental Inventory of Passenger Transportation in the United States bills itself as “the first comprehensive environmental life-cycle assessment of automobiles, buses, trains, and aircraft in the United States.” The report, by Mikhail V. Chester of the Institute of Transportation Studies at Berkeley, goes far beyond counting the fuel consumed by vehicles. It considers the energy and materials used to build stations

, terminals, roadways, runways, tracks, bridges, tunnels and parking, as well as maintenance, heating, lighting and more. A full life-cycle accounting of travel modes has been a long time coming; it is critically needed and tremendously welcome.

The findings on life-cycle energy use are summarized in this chart:

Read on for a summary of the findings, and a discussion of how the results are affected by urban design context.

Read more

British Train Ridership Hits Peacetime Record

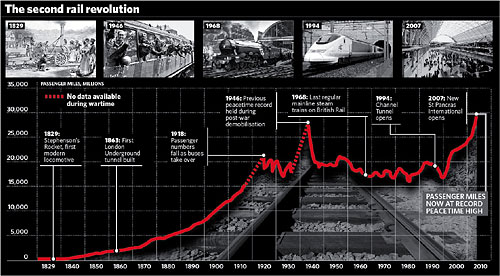
A story about record train ridership in the UK includes this impressive graphic:

second_rail_revolution.jpg
Image credit: The Independent

The chart is based on the Association of Train Operating Companies (Atoc) booklet The Billion Passenger Railway. The booklet features several articles — including one that forecasts that the competitiveness of 21st century cities will depend on their high speed rail links. Andrew Curry reports from September 2083:

Read more

APTA Study on Transit and Land Use

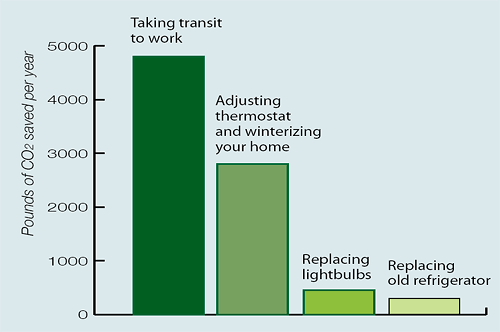
The recent study Growing Cooler, coordinated by Smart Growth America and published by the Urban Land Institute, found that “Typically, Americans living in compact urban neighborhoods where cars are not the only transportation option drive a third fewer miles than those in automobile-oriented suburbs…”

On March 10, 2008, the American Public Transit Association released a closely related study that supplemented those findings. APTA’s study, The Broader Connection between Public Transportation, Energy Conservation and Greenhouse Gas Reduction, tackles the same topic from a different direction. It asks, How does the availability of transit affect land use

, its energy efficiency, and its greenhouse gas emissions — not only for transit riders but for those who don’t ride transit?

The conclusion: Not only is the land use effect significant, it is major. Below the fold, some excerpts from the study and key findings.

apta-co2-chart.gif
Image credit: APTA

Read more

Fun with Density and Transit Statistics

Conventional wisdom holds that the U.S. is too spread out for workable mass transportation except in a few high-density cities. Urban planning expert Anthony Downs offers this explanation:

But in 2000, at least two thirds of all residents of U.S. urbanized areas lived in settlements with densities of under 4,000 persons per square mile. Those densities are too low for public transit to be effective. Hence their residents are compelled to rely on private vehicles for almost all of their travel, including trips during peak hours.

Traffic: Why It’s Getting Worse, What Government Can Do

Is that accurate? It all depends on statistics and assumptions, both of which are endlessly susceptible to manipulation. For instance, Downs uses “settlements” as the geographic unit of analysis and calculates how many Americans live below a certain density threshold.

That’s one approach, but there are many different approaches. We could use other geographic units and find out the average density in each of them.

Geographic Unit Population Population
% of U.S.
Land Area
(sq mi)
Land Area
% of U.S.
United States 281,421,906 100 3,537,438 100
Metropolitan Areas 225,981,679 80.3 705,790 20
Urbanized Area 192,323,824 68.3 72,022 2

Source: U.S. Census 2000

Looking at the entire United States, what impresses is the vastness and diversity of the land. It’s the America of spacious skies, amber waves of grain, and purple mountain majesties; of trackless tundra, sizzling deserts and rocky badlands.

But look at the urbanized area of the nation and a different picture emerges. Sixty-eight percent of Americans live on just 2 percent of the U.S. land area. Seen in this light, the large majority of the U.S. population is remarkably concentrated on the land. What implication does this have for population density?

Read more

Streetcars of Eugene

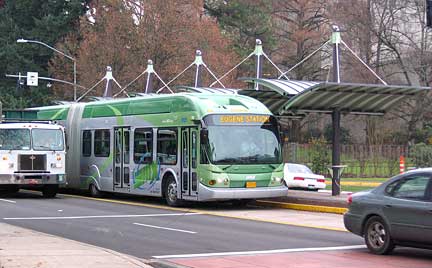
Bus rapid transit service begins in Eugene, Oregon on Sunday, January 14, 2007. The service is called EmX (short for Emerald Express) and it features custom-designed hybrid-electric vehicles, and stops with raised boarding platforms and real time route information. The route will run four miles from downtown Eugene to downtown Springfield with two and a half miles in exclusive bus-only lanes.

eugenebrt.jpg
Photo by Lane Transit District

In honor of the EmX beginning service, here is a transit history poster I made some years ago, titled Streetcars of Eugene 1907-1927. The poster shows the system in 1912, a period when streetcars were used to boost real estate development. That’s why some of the lines ran through empty fields. These days, planners recommend “land use first”: The demand for development and codes that support transit oriented development should be in place before transit lines are built.

Read more