Author Archives: Laurence Aurbach

Functional Classification and Safety Statistics

Which types of urban roadways are the most dangerous? Major arterial or minor arterial? Freeway or local street? The field of motor-vehicle safety statistics is more than a century old. One would expect such a mature field to have settled the basic question of the best way to report fatality risk. But that’s not the case, and what’s more, the most common method of reporting risk may be mathematically invalid. We may be getting an incorrect understanding of the types of roadways that have the highest fatality risk.

Engineers and traffic officials often say freeways are the safest roadways and local streets are the most dangerous. That fits the view of mainstream engineering, which points out that local streets have the closest spacing of driveways and intersections, and therefore the densest occurrence of “conflict points” where crashes can happen.  Freeways and expressways have strictly controlled access in order to eliminate intersections and driveways.

That view of safety is one of the main justifications for the mandated federal policy called functional classification. The goal of functional classification is to channel a large percentage of traffic onto a small percentage of roadways, specifically freeways, highways, and arterial roads. Those roadway types are the most elaborate and designed to carry high volumes of fast traffic

https://sai.org/azor/index.html

, often with full or partial access control. Functional classification has been very successful at achieving its basic goal of channeling and concentrating traffic.

VMT-and-RoadwayMiles

Chart 1: Distribution of urban traffic and urban roadway miles. The chart shows the United States’ skewed pattern of travel, which is largely the product of hierarchical and dendritic roadway layouts supported by functional classification.

Chart 1 shows how functional classification sorts roadways into a range of types. The nation’s skewed distribution of traffic is apparent. Seventy-seven percent of traffic is carried by eighteen percent of roadways — by the so-called “higher-class” freeways, expressways, and major arterials. Traffic in the official statistics is reported as vehicle miles traveled (VMT). National VMT is the sum of annual state estimates, which are based on gasoline consumption, traffic counters, personal travel questionnaires, and other methods.

To compare the safety of roadways, engineers and administrators adjust the raw statistics to account for exposure. The Federal Highway Administration (and indeed the entire mainstream traffic engineering field) does that by dividing the number of fatalities by VMT. In other words, they use travel mileage as the measure of risk exposure. The chart based on that metric looks like this:

Fatalities-VMT

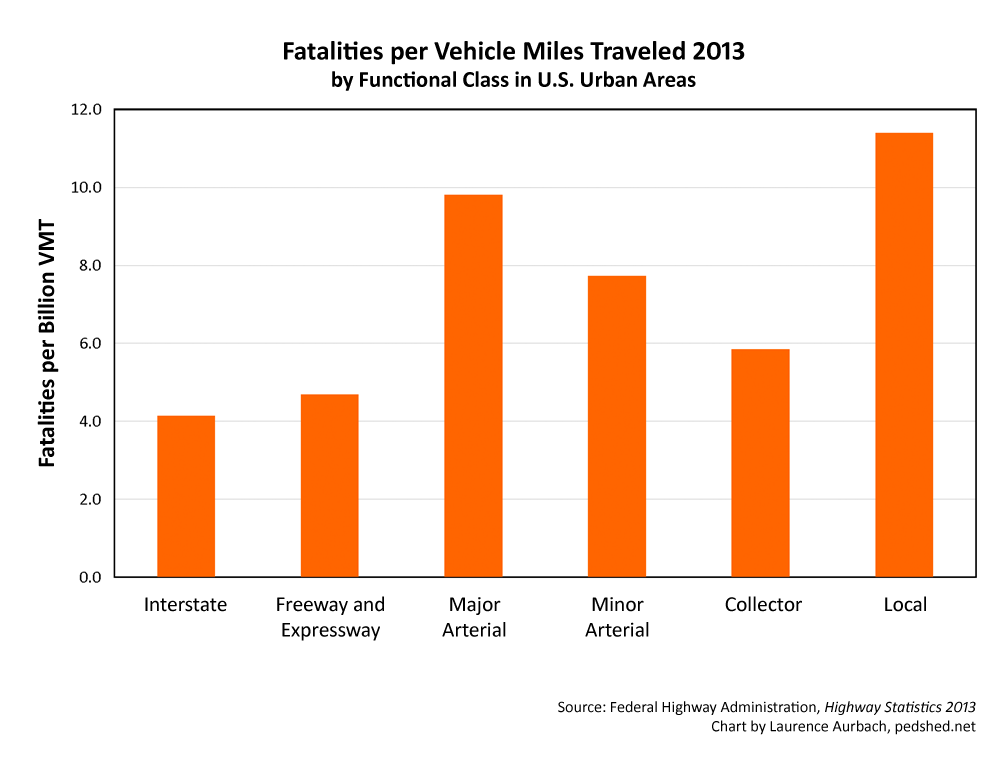
Chart 2: Fatalities per VMT by functional class

Chart 2 confirms the mainstream view. Interstates are the safest facilities and local streets are the most dangerous. But is that view truthful? Actually, the official statistics contain a critical logical flaw. VMT (that is

Kup Doxycycline bez recepty

, travel distance) is the product of speed and time. Therefore speed is fundamentally intertwined in the fatalities-per-VMT metric. The way the variables are related produces the following outcome. For any given amount of travel time, and assuming identical roads and drivers, the fatalities-per-VMT metric will always report that faster speed is safer (see Appendix 1).

But that’s opposite to basic physics and everything we know from traffic safety research. Faster speed is more dangerous on most roadways

levitra usa

, and it’s certainly more dangerous on full-access urban streets and arterials. Does a better metric exist?

Read more

A Computerized Method to Judge Streetscape Quality

Architects and urban designers have debated streetscapes for many decades. As early as 1889, the Austrian architect Camillo Sitte wrote of the importance of continuous, connected building facades that lined streets and defined their form. Beautiful public spaces have a sense of enclosure, said Sitte; they feel like outdoor rooms. A few years later the German architect and planner Josef Stübben covered the height-to-width proportion of streets in his handbook of city planning.

In the 1920s and 30s the architect Le Corbusier issued several emphatic rejections of such ideas. “DEATH TO THE STREET

http://antolaphoto.com/prednisolone/index.html

,” he thundered, decrying the traditional streetscape as dangerous, unhealthy, chaotic, and congested. The ideas promulgated by Corbusier and other modernist planners were in tune with the needs of the motor industry: dispersed towers

, wide buffers, and large highways. The design of new highways and arterials in cities came to resemble the auto-oriented visions of modernist planners.

The chorus of voices defending traditional streetscapes snowballed during the 1960s-1990s. Hundreds of new streetscapes were built based on traditional patterns. Infill development re-established traditional streetscapes in existing city districts. Today one can find both patterns actively promoted in all cities of the world. The debate continues as vigorously, and sometimes as contentiously, as ever.

One condition keeping the debate alive is the various arguments, theories, and polemics lack solid empirical support. Many designers and engineers have a gut feeling about the best way to design streetscapes but statistical evidence is thin. Several streetscape surveys have been developed

, and researchers have used them to carry out a few studies. The surveys require teams that manually evaluate each street segment using checklists of tens or hundreds of factors. The process is laborious, slow, and expensive; and as a result, the studies to date have been limited and somewhat inconsistent.

That’s why a thesis by Chester W. Harvey titled “Measuring Streetscape Design for Livability Using Spatial Data and Methods” (2014) is an important advance in the urban design field. Harvey developed a computerized method to evaluate the essential form of streetscapes. He tested the results against a survey of streetscape appeal and found significant relationships. The theories and speculations of the past 125 years have finally been confirmed with a large sample set: streetscapes shaped like outdoor rooms are perceived to be safer and more attractive to walk in. And that is only the beginning, as the method offers many other potential avenues of investigation.

Read more

Sustainable Development and Mortgage Default

Multifamily properties with sustainability features have a significantly lower risk of mortgage default. That’s the conclusion of a May 2013 report by Professor Gary Pivo

Buy Levitra online

, which is available from Fannie Mae. The lengthy and self-explanatory title of the report is The Effect of Transportation, Location, and Affordability Related Sustainability Features on Mortgage Default Prediction and Risk in Multifamily Rental Housing.

Professor Pivo was able to access Fannie Mae’s database of multifamily loans. The study looked at 37

Prednisolon tabletten Rezeptfrei kaufen

,385 loans that ranged in age from brand new to 30 years old; the average loan age was 6 years. The default rate of properties in this study was a very low 0.86%. That means only a few hundred properties were in default.

The average location on the urban-rural spectrum was “metro city” — between the urban center and the urban outskirts. The average number of dwellings on each property was 95 (standard deviation was 125 dwellings) and the average construction date was 1968 (standard deviation was 26 years). Both of the latter two measurements had a large standard deviation

, meaning the data values were spread over a wide range.

The study tested the portfolio of loans with seven sustainability variables. The variables were based on U.S. Census 2000 statistics for census tracts, census block groups, and other sources.

  1. Commute time: Commute time in minutes for those who work outside the home
  2. Rail commute: Do at least 30% of the residents take a subway or elevated train to work?
  3. Walk commute: The percentage of residents who walk to work
  4. Retail presence: Are there at least 16 retail establishments nearby?
  5. Affordability: Are some of the units required to be affordable?
  6. Freeway presence: Is the property located within 1,000 feet of a freeway?
  7. Park presence: Is the property located within 1 mile of a protected area?

Read more

Proof of LID?

Washington DC, like hundreds of other cities in the U.S., has a dirty water problem. The problem goes by the name of combined sewer overflow (CSO). CSO is a fancy way of saying when it rains a lot, our shit and piss go straight into the river untreated.

This foul condition is caused by sewer systems that combine sewage flows (from toilets and drains) with stormwater flows (from lots and streets). Seven hundred and seventy-two cities in the U.S. have these antiquated systems that overflow when it rains a lot. Cities that were built after 1900-1910 solved the problem by building separate systems for sewage and stormwater.

Washington DC is under a court order to fix the problem. The original court-ordered plan is a multidecade

Ivermectin (Stromectol) kaufen Ohne Rezept Online In Schweiz

, multibillion-dollar program of installing giant water storage tunnels. It would reduce raw sewage discharges by 98 percent and would be paid for by doubling water bills over a 20-year period.

In August 2011, the DC Water and Sewer Authority proposed a test of low-impact development (LID) in order to reduce its costs and construction requirements. LID is a set of stormwater management practices that directs runoff to places where it can soak into the ground: swales, rain gardens, trenches, porous pavement, etc. If we put stormwater into the ground instead of sewer pipes, says DC Water, the pipes will overflow less often.

But local environmental groups are wondering just how feasible the DC Water proposal is. They are objecting to it — in particular, the proposed eight-year delay in tunnel construction and potential reductions in tunnel capacity. While proven cleanup techniques are delayed, DC Water will experiment with LID techniques that may or may not provide significant reductions of stormwater runoff. Washington Post columnist Mike DeBonis describes the situation:

Read more

New Urbanism and Congestion Reduction

A Wall Street Journal article, The Hidden Toll of Traffic Jams

, covered several studies that linked vehicle exhaust with a variety of health impacts. The WSJ spun this as a congestion problem, even though it mentioned only one study that investigated congestion (at a toll plaza on Interstate 95). The WSJ also called the redesign of Times Square a congestion reduction measure, but in reality the congestion impacts have been mixed and travel times have increased on some routes. The Times Square redesign primarily benefits livability and pedestrian safety and comfort.

Maybe this goes without saying, but I think new urbanism has to be careful about the kind of congestion relief it advocates. There are some street network improvements that help increase the walkability and livability of an area. There are other types of construction that mostly help cars speed faster and increase sprawl.

The former can include a fine-grain mesh of small blocks

antibiotika-online.com

buyantibiotics.space

, eliminating curb cuts for driveways

Buy Betapace Online without Prescription

, and intelligent systems like predictive navigation. The latter can include roadway widening

Online Pharmacy

, flyovers, and new freeways. There are also some measures that can go either way, like tunnels, intersection improvements, and traffic signal coordination. Depending on the design and context, these can contribute to livability or make a thoroughfare more pedestrian-hostile.

Hybrid vehicles like the Prius turn the congestion equation upside down: at lower speeds they rely more on electric propulsion, which reduces gas consumption, emissions, and health impacts. Plug-in hybrids and battery electric cars do even better. From the point of view of street-level vehicle pollution

perfect money problems

Order Amoxicillin

, these cars are the best thing since unleaded gasoline.

Entry limits for entire urban districts are the most direct way to reduce congestion, but outside of historic European city centers there doesn’t seem to be much appetite for doing this. Congestion tolls/fees for urban districts can be effective, but they are regressive, and the political process gets hung up on the costs and discounts the benefits. Other transportation demand measures can help

buyantibiotics.website

, and the framework and metrics used to identify congestion are critical. Todd Litman writes:

… increased development density tends to increase congestion measured as roadway level-of-service or delay per vehicle trip, since more trips tend to be generated per acre. From this perspective, Smart Growth tends to be harmful and sprawl tends to be helpful for reducing congestion problems. However, higher density tends to increase land use Accessibility and Transportation Options, resulting in shorter trip distances and shifts to alternative modes such as walking and public transit. Although streets in higher density urban areas may experience more level-of-service E or F

, implying serious congestion problems, urban residents spend less time delayed by congestion because they have closer destinations and better travel options. As a result, per capita (as opposed to per-vehicle trip or per-driver) congestion delay tends to be greater in lower-density

, automobile-dependent suburban areas such as Los Angeles and Houston than in higher-density urban areas such as New York and San Francisco, because low-density areas have more per-capita vehicle mileage.

Congestion Reduction Strategies, Victoria Transport Policy Institute

New urbanists have to be informed and nuanced when navigating the congestion debate, because it easily can be turned to favor sprawl.

Below the fold: links about the level-of-service measure and its reform.

Read more

The Language of Towns & Cities

I’m very pleased to say The Language of Towns & Cities: A Visual Dictionary has been published and is available for purchase. The massive tome was written by Dhiru Thadani with more than fifty contributors. I was the editor of the book as well as a contributor.

My leading observation is that the title is a misnomer. It’s not a visual dictionary, it’s a visual encyclopedia — a combination of reference book and coffee table book. It represents about 15 years of creative production by Dhiru, including his maps of urban spaces around the world and his insights from 30 years as an architect and town planner. Numbers also tell the tale: the book consists of 804 pages; more than 500 subject matter entries ranging from single paragraphs to full essays; and more than 2,500 diagrams, illustrations, and photographs.

The book is physically heavy and bulky. Its dimensions are 10.4″ x 10.4″ x 2.75″ and it weighs 9 pounds… not what you would call a portable book. Once it gets parked on a desk or coffee table, it’s not going to move far.

The Language of Towns & Cities is a fine example of the craft of bookmaking. Credit is due to Rizzoli Publications and the Chinese firm that manufactured the book. It is beautifully printed

Order Ditropan Online no Prescription

http://allfreethings.com/cipro/index.html

, with heavy coated paper stock that showcases the vibrant, lush photography. The binding is sturdy and lies flat at any page, which many books these days are not made to do.

The authorial tone of the book is accessible and straightforward, aiming for clarity rather than obfuscation by jargon. Indeed, The Language of Towns & Cities is a work of anti-jargon, because it introduces concepts, defines terms, explores patterns, and reveals history.

Being an encyclopedia, The Language of Towns & Cities is arranged alphabetically. Rob Krier’s review on Amazon.com describes his childhood joy at browsing reference works. Krier says that reading Language made him feel the same way. Each flip of the page brought a different subject into view, encouraging serendipitous exploration and discovery.

To sum up, Language combines beautiful images, a wide variety of subject matter, accessible writing, and fine bookmaking. I call it the ultimate browsing book on urban design.

What follows is the dust jacket book description, list of contributors, and a sample from the book including the complete table of contents.

Read more

Location, Transportation, and Urban Design in LEED 2012

The draft LEED 2012 rating systems were released for public comment today. The proposals contain new and revised credits that relate to the location, transportation options, and urban design of projects. Here I’ll review the changes that are of greatest interest to new urbanism and smart growth advocates.

The following proposals are in the Building Design & Construction document, which includes most of the LEED rating systems. “LT” stands for Location and Transportation

, which is a new category within LEED systems.

Please note that “LEED 2012” is my own personal shorthand for these draft proposals. The more accurate and official term is “proposed update to LEED” with no year associated.

LT Prerequisite: Bicycle Storage

LEED has been critiqued for a variety of flaws both real and alleged. But one thing you can always count on is a mention of the bike rack credit. Every critic or reporter has a sworn duty to point out that bike racks can earn a LEED credit point. Installing bike racks is cheap and easy compared to (for instance) making buildings more energy efficient, and may be worth the same number of credit points. This has consistently been presented as an example of LEED illogic.

Worry no longer! Installing bike racks is now a prerequisite for all LEED projects, except for those in totally unbikeable locations. The racks have to be safe and convenient — no stashing behind garbage dumpsters. Residential projects provide additional bike storage for their residents.

This prerequisite is both functional and symbolic, providing a visible signal that transportation mode choice is an essential aspect of LEED. Also, creating a bicycle storage prerequisite allows the bar to be raised for performance in the “Bicycle Network, Storage and Changing Rooms” credit.

Read more

The Power of Intersection Density

Intersection density is the number of intersections in an area. It corresponds closely to block size — the greater the intersection density

modafinil-schweiz.site/

https://deutschland-doxycycline.com

, the smaller the blocks. Small blocks make a neighborhood walkable. This diagram shows three street layouts — extremely walkable, moderately walkable, and unwalkable — with their counts of intersections per square mile:

Intersection density makes surprising news in a study by the formidable academic duo of Reid Ewing and Robert Cervero. They have published Travel and the Built Environment: A Meta-Analysis in the Summer 2010 issue of the Journal of the American Planning Association.

As the title notes, the study is a meta-analysis: a study of 50 other studies about travel and the built environment. The authors look at the results from each of the 50 studies

, and then pool all of those results into ten built environment measurements, including intersection density.

Their findings? Of all the built environment measurements, intersection density has the largest effect on walking — more than population density, distance to a store, distance to a transit stop, or jobs within one mile. Intersection density also has large effects on transit use and the amount of driving. The authors comment,

This is surprising, given the emphasis in the qualitative literature on density and diversity

, and the relatively limited attention paid to design.

In other words, intersection density is the most important factor for walking and one of the most important factors for increasing transit use and reducing miles driven, but gets relatively little attention in research and in public policy.

Read more

Dense and Beautiful Stormwater Management

Download a print version of this essay.

Consider two views about sustainable cities. Call one the Green City, and the other the Compact City.

Green City: A sustainable city is a green city. It has lots of plants and trees that make the city more beautiful, provide habitat for wildlife, and help clean the air and water. It even has community gardens where people grow food and flowers.

Compact City: A sustainable city is a compact city. It has lots of buildings and activities conveniently close together so people can walk, bike, and take transit. It even has paved squares and plazas where people gather and participate in markets, performances, free speech, and recreation.

The Green City is popular as never before. Everyone wants more trees, more landscaping, more living green in their neighborhoods. Stormwater standards are shaping up to be the major vector by which the Green City is delivered — even mandated, in many cases. What does this mean for the Compact City? Is there a conflict between the two views?

In fact, both views are necessary. We have the technical know-how to create neighborhoods that are both compact and green. But sometimes standards and regulations don’t recognize this, particularly stormwater standards. Well-intentioned stormwater standards and regulations can put compact urban development at a disadvantage. They may have the unintended consequence of promoting sprawl, which hurts watersheds more than compact development.

Unlike many barriers to compact development, this is not a technical, social, financial, or even political problem. It is largely an administrative problem. Doing the right thing is simply more difficult for administrators.

This essay suggests four guidelines for stormwater management that support and encourage compact neighborhood development. These guidelines can help put regulations back on the right track, and may also help to make the job of administering stormwater more manageable:

  1. Recognize density as a best management practice
  2. Allow off-site mitigation, preferably in the neighborhood
  3. Plan according to the Transect (neighborhood context)
  4. Design according to the Transect (neighborhood context)

Read more

Robert Charles Lesser & Co. Market Studies

In a September 2009 paper The Market for Smart Growth, market researchers at Robert Charles Lesser & Co. reported strong market demand for housing in new urban communities. In a number of U.S. cities, their consumer surveys found at least one-third of the market prefers new urbanism, transit-oriented development, and urban and suburban infill communities:

Proprietary consumer research conducted by Robert Charles Lesser & Co. LLC (RCLCo) in various U.S. real estate markets has consistently found that about a third of respondents, given the option, would seriously consider New Urbanist communities and housing products in selecting a new home. The majority of the RCLCo studies were conducted for builders and developers as input to planning new smart growth developments. … An examination of the survey evidence relative to consumer housing preferences in the context of demographic projections demonstrates that the size of the market for dense walkable communities is increasing. (emphasis added)

Read more

An Introduction to LEED-ND for CNU Members

This summer, members of the Congress for the New Urbanism will vote on LEED for Neighborhood Development. LEED-ND is a system for rating the sustainability of neighborhoods. The vote is a membership referendum on whether CNU endorses the release of LEED-ND in its present state. To encourage informed participation in the vote

Kup LevitrÄ™ bez recepty

, the DC chapter of CNU has released An Introduction to LEED-ND for CNU Members.

The six-page article covers the essential points that CNU members should know as they consider their ballot. Topics include the background of LEED, how the system is administered, credits of special interest to new urbanism, what the system does and does not do, and the purpose and meaning of the vote. The article is written by Laurence Aurbach, CNU DC Chapter secretary and member of the LEED Location and Planning Technical Advisory Group.

Cross-posted from CNU DC

Read more

Towards a Functional Classification Replacement (Part Three)

Download a print version of this essay.

Part One of this essay covers the background, characteristics and drawbacks of functional classification, and evaluates some of the leading alternatives. Part Two continues by proposing a replacement, a sustainable transportation network classification, covering the block-scale and neighborhood-scale relationships. Part Three concludes by covering the city-scale relationship and the congestion-related impacts of a sustainable network.

City Scale

The ideal pattern of regional growth has been debated at least since the 19th century. In the 1960s and 70s the focus of the debate sharpened on efficiency and sustainability, and the “Compact City” was suggested to be the ideal. The Compact City redirects all growth into a single urban core, maximizing density while minimizing the consumption of farms, forests and agricultural land. It explicitly counteracted the dominant trend of decentralized suburban sprawl.

Some of the benefits of the Compact City idea have been confirmed by researchers. Cities with higher density and more compact form have much less per capita driving (Newman and Kenworthy, 1999). In existing cities, the trend of sprawling suburban growth causes an explosion in the amount of auto driving; a policy of refocusing growth, mixed use and transit in the urban core will halt that explosion and slightly reduce the amount of driving (Simmonds and Coombe, 2000).


Analysis of city-scale development patterns shows that focusing growth on high-capacity transit nodes will have the greatest CO2 reduction effect. Image credit: Eliot Allen, “Cool Spots”

Read more

Towards a Functional Classification Replacement (Part Two)

Download a print version of this essay.

Part One of this essay covers the background, characteristics and drawbacks of functional classification, and evaluates some of the leading alternatives. Part Two continues by proposing a replacement, a sustainable transportation network classification, covering the block-scale and neighborhood-scale relationships. Part Three concludes by covering the city-scale relationship and the congestion-related impacts of a sustainable network.

A sustainable network classification ideally will do several things.

  • Actively encourage sustainability (as defined previously in the sustainable transport section); do not support unsustainable network patterns and operations.
  • Be concise, easy to remember and easy to explain.
  • Address a range of scales, a range that is at least as wide as that covered by functional classification.
  • Incorporate advanced knowledge about network function and best practices in network planning.

To reach these goals, a sustainable network classification is proposed. The classification has three primary relationships, each applying to a different scale. The three scales are block scale, neighborhood scale, and city scale. This allows each relationship to focus on the factors most relevant to its scale, without unnecessarily confusing factors from different scales or combining them inappropriately.

Read more

Towards a Functional Classification Replacement (Part One)

Download a print version of this essay.

Every field has its foundational working concepts and the field of traffic engineering is no exception. It has a concept called functional classification, which is the core, guiding idea underlying the roadway system of the United States and many other nations. Functional classification is the conceptual foundation of the auto-dependent built environments where most Americans live.

The primary vision of functional classification is moving more and more cars at faster and faster speeds. This has certain benefits, but also a wide range of disastrous consequences for the built environment and the people who live in it. Hundreds, possibly thousands of reform-minded transportation planners and engineers have determined that the roadway functional classification system should be replaced.

It should be replaced by guiding concepts that support a more efficient, safer, less-polluting transportation system – concepts that support a wider range of choices for neighborhood living and daily travel. What factors should be considered when formulating a sustainable transportation system? What proposals have already been made?

Part One of this essay explores those questions. Part Two continues by proposing a replacement, a sustainable transportation network classification, covering the block-scale and neighborhood-scale relationships. Part Three concludes by covering the city-scale relationship and the congestion-related impacts of a sustainable network.

Read more

e²: Good Urbanism on TV

The Brad Pitt-narrated PBS series e² ( “the Economies of being Environmentally conscious”) has several episodes about urban design and planning. For a general introduction to walkable, transit-oriented design and planning, I recommend the episode “Portland: A Sense of Place.” It focuses on the city’s rail transit and aerial tram, the Pearl District redevelopment, and the quality of life that can result from downtown revitalization with good urban design.

Even better is the episode “Seoul: The Stream of Consciousness” which focuses on Seoul’s Cheonggyecheon Restoration Project. This was a major freeway in the heart of the city that was torn down and replaced with a linear park and recreated running stream. The best thing about this episode is the sense of hope and renewal for the city that is conveyed by the residents’ pride in their new park.

These episodes are beautifully produced

2pharmaceuticals.com

https://stromectol-europe.com

, not wonky at all, and will certainly hold anybody’s attention. The episodes can be viewed at www.e2-series.com. Click on “Webcasts” and scroll down to the episode titles. They are also available on DVD and from iTunes.

Read more