This is part one of a series. See also Historical Background • Latter Half of the 20th Century • Neighborhood Walking • Neighborhood Crime • Vehicle Miles and Traffic • Crash Safety
Thoroughfare network connectivity is the single most important element of sustainably-built cities and towns. That may sound like an odd statement, particularly if you’ve never even heard of it. Connectivity has so many interrelated effects on so many urban functions, and more people should recognize how truly essential it is.
Why is connectivity so important? There are many steps to trace, so in this post I’ll start with a definition and overview.
The thoroughfare network is simply the system of arterials, collectors, boulevards, avenues, streets, roads, etc., in an area. Connectivity refers to the directness of travel routes between any two locations, and the number of alternative routes available for traveling between any two locations.
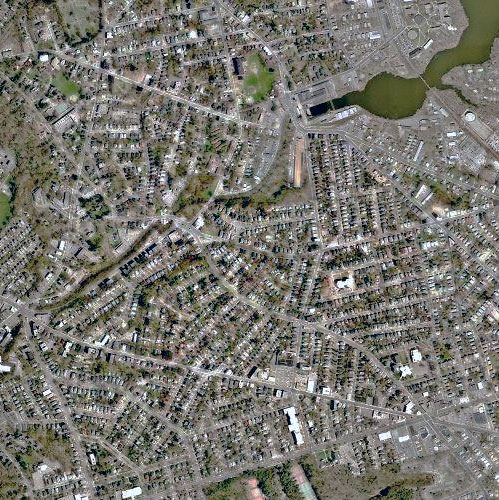
A comparison is helpful. Here is a high-connectivity network (Location: Springfield, MA. Image: USGS Urban Areas, 2001. Scale: 4000 m x 4000 m):
Here is a low-connectivity network (Location: Alpharetta, GA. Image: USGS Urban Areas, 2002. Scale: 4000 m x 4000 m):
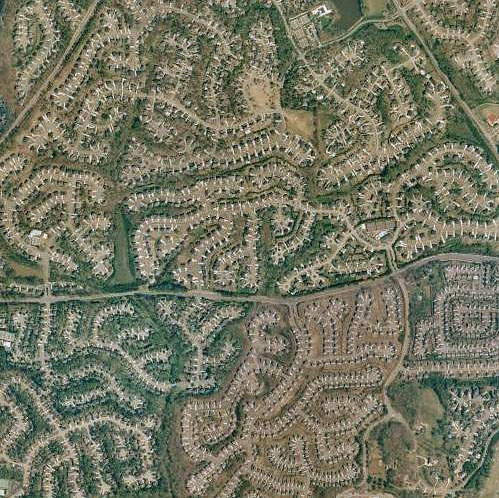
In the aerial photos, pick out any two locations. In the high-connectivity photo, the shortest travel route will usually be fairly close to a straight line, with just a few jogs around block corners. There are many alternative routes available. In the low-connectivity photo, the shortest route will usually be very circuitous — from cul-de-sac to collector to arterial, then along another winding route to another cul-de-sac. Two homes a hundred yards apart by air might be half a mile apart by the thoroughfare network. Also, there are few or zero alternative routes available.
Network connectivity largely determines whether an area develops as an urban fabric of neighborhoods, or a suburban collection of pods, i.e. sprawl. That in turn affects the environment, sustainability, long-term adaptability, and other quality-of-life issues.
Durability of the built environment
Think about what parts of the built environment endure the longest. If we were to rank them from most transient to most enduring, it might look something like this:
1. Building facades
2. Building uses (e.g. businesses)
3. Buildings
4. Lot boundaries
5. Thoroughfare patterns
Building appearances can change the quickest with a new coat of paint, new siding, or a new facade. Businesses are next; some last a few months, some a few years, but very few last longer than a generation. Most contemporary buildings are designed to last a few decades, and serviceable buildings are frequently knocked down and replaced. Even well-built historic structures are subject to the ravages of natural and manmade disasters.
Next are lot boundaries, which endure until they are subdivided or combined with other properties. Lot boundaries last for decades and often longer. (After the Great Fire reduced London to rubble, Christopher Wren and others drew up plans for rebuilding the city as a grand capital. But none of the plans were adopted, because small property owners were desperate to rebuild and the government did not have the funds to buy them out. The old lot boundaries were retained.)
Finally, there is the thoroughfare network, the element that endures the longest. Street patterns can be in place for centuries. Even as empires rise and fall over millennia, thoroughfare patterns have been re-used. Examples include the medieval European bastides that were built on the sites of Roman settlements, using grid plans established a thousand years before. Whatever impact the network pattern has on urban function, for better or for worse, it tends to outlast all the other urban design elements.
Network connectivity operates at several scales:
- Within individual neighborhoods
- Between neighborhoods and groups of neighborhoods
- At the regional level
Low-connectivity networks in new development are the result of deliberate planning and engineering choices to implement the standardized system of arterial/collector/local street. This type of network is sometimes called a dendritic (branching tree-like) network.
Many developers and engineers prefer dendritic networks, and many homebuyers prefer cul-de-sacs. The reasons you’ll hear for those preferences include: reduced volume of traffic, elimination of through traffic, reduced number of intersections and traffic conflict points, crime & safety, quiet, and exclusivity. Some of these reasons are misperceptions, and others can be addressed by means other than low connectivity.
In future posts I’ll talk about how low connectivity generates sprawl, the different scales of connectivity, and arguments for and against various levels of connectivity.
Resources
The Hawthorne Traffic Equation is explained in a short essay by Vince Graham and an illustrative PowerPoint by Victor Dover. The equation calculates the number of alternative routes available in a grid network.
I don’t know if you are familiar with the work of Space syntax? Forgive me if you are already well versed in this, but if not, i think you will be interested in this empirical, scientific approach to connectivity which seems to touch on many of your concerns.
http://www.spacesyntax.com -consultancy
http://www.spacesyntax.org -research unit at UCL
Yes, Robert, Space Syntax is an integral component of my proposal for a sustainable network classification. Please take a look at that; I’d be interested in your feedback.
In the resources you say ‘The equation calculates the number of alternative routes available in a grid network’ I would like to know what the equation is?? I need to work out how many alternate routes I have on my grid but don’t know the equation to use.
Amanda, I’ve fixed the broken links in the Resources section, so try them again. Also, see this comment.