Download a print version of this essay.
Part One of this essay covers the background, characteristics and drawbacks of functional classification, and evaluates some of the leading alternatives. Part Two continues by proposing a replacement, a sustainable transportation network classification, covering the block-scale and neighborhood-scale relationships. Part Three concludes by covering the city-scale relationship and the congestion-related impacts of a sustainable network.
A sustainable network classification ideally will do several things.
- Actively encourage sustainability (as defined previously in the sustainable transport section); do not support unsustainable network patterns and operations.
- Be concise, easy to remember and easy to explain.
- Address a range of scales, a range that is at least as wide as that covered by functional classification.
- Incorporate advanced knowledge about network function and best practices in network planning.
To reach these goals, a sustainable network classification is proposed. The classification has three primary relationships, each applying to a different scale. The three scales are block scale, neighborhood scale, and city scale. This allows each relationship to focus on the factors most relevant to its scale, without unnecessarily confusing factors from different scales or combining them inappropriately.
In addition, there are two imperatives that should apply in almost all contexts.
One, the sustainable network has high connectivity throughout. Connectivity can be defined as the combination of route directness and route choice. Route directness means the routes from point to point are direct. It can be expressed as the ratio of straight-line distance to shortest-path travel distance. The closer to a 1:1 ratio the better. Route directness entails small blocks and few or no dead ends, and eliminates long detours that discourage walking. Route choice means there are multiple, relatively direct routes from point to point. Route choice reduces network bottlenecks and provides the perceptual variety that encourages walking.
Two, sustainable networks have high place accessibility throughout. Place accessibility is the ability of people to get to their activities and destinations. To have high place accessibility, people must be in close proximity to a wide mix of uses and activities, such as jobs, shopping, services, education, religious, civic and recreation. High place accessibility is enabled by networks that let people quickly and easily walk
, bike, and ride transit to their destinations. Areas with good place accessibility can be livable and economically competitive as well as efficient; excessive mobility is not a requirement.
Block Scale
The block scale is the scale of the immediate environment — what the person on the street experiences. This scale addresses design elements that make a place livable, such as porches, welcoming shop fronts, active frontages, street trees, thoroughfare size, and the proportion of the right-of-way devoted to the thoroughfare. The sustainability of thoroughfares at this scale is closely related to the efficient use of space.

Amount of space required to transport the same number of passengers by car, bus or bicycle. Photo credit: Press office, City of Münster, Germany.

The same 40 people (1) in their cars, (2) seated at car spacing, (3) seated at bus passenger spacing, (4) as pedestrians and bicyclists. Photo credit: Phil Sheffield, Tampa Tribune
The efficient use of space, in the form of compact, mixed use development with human-scale thoroughfares, is a necessary design aspect of safe and attractive walking environments. Space efficiency reduces land consumption and runoff pollution. Travel modes that use space most efficiently also use energy more efficiently. Space-efficient modes support more “location-efficient” housing where the cost of housing plus transportation is less than at the suburban fringe.
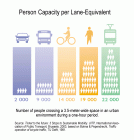
Space efficiency of various travel modes. Image credit: UITP.
The space efficiency of travel modes is measured in terms of person-capacity, which is the number of people that can traverse a given space over a given time period. This measurement encompasses multimodal capacity and also includes pedestrian capacity. It is a means of making all modes comparable on a universal scale. It prioritizes rail, walking and bicycling, as shown above.
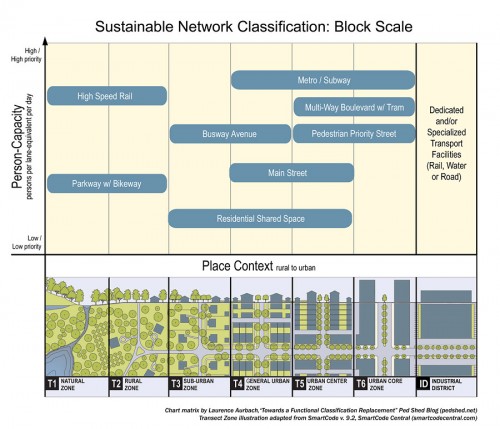
Block scale relationship: person-capacity to place context. The matrix only shows a representative selection of network facilities, not a complete inventory. Chart matrix by Laurence Aurbach. Transect zone illustration adapted from SmartCode v.9.2 (smartcodecentral.com).
The person-capacity to place context relationship is the primary relationship at the block scale. When person-capacity is associated with walkable place context, the resulting matrix optimizes the combination of network and place, prioritizing the operation of sustainable travel modes in livable, safe and attractive environments. The SmartCode Transect is adapted to this matrix because it is systematic and well-defined, is coming into widespread use, and is supported by a growing body of literature and case experience. However, other transect- or context-based classification systems may work equally well.
There are a number of reasons for combining all modes into a person-capacity metric.
- For policy, it places all modes on an equal footing in one framework in order to set priorities and make cost-benefit evaluations. It allows all modes to be evaluated by the same standard.
- For professional guidance, it breaks down the silos that usually separate each mode, each with its own specialist community with standards and practices that do not interoperate. It reaches across disciplines, giving a holistic perspective and a greater focus on the big-picture systems view, i.e., overall efficiency
, sustainability and livability.
- It can be flexible. Planners can break out modes as needed, resulting in models that may be similar to existing practices. The difference is the awareness that such broken-out models are fragments of the whole. They will be re-incorporated into the complete network as is appropriate in the planning and operating processes.
Advantages: Person-capacity plus a context- or transect-based framework yields a holistic perspective that better addresses efficiency and livability.
Disadvantages: A homogenizing focus on person-capacity may obscure the unique, qualitative benefits of each mode. The inclusion of place context involves additional layers of planning and politics, which makes network planning more complex and time-consuming.
Mode Networks and Place Context
Mode networks are the building blocks of the complete network. At some points in the planning process individual mode networks will be considered; at other points the complete network will be the focus. For planning and engineering purposes, mode networks may need to be considered on their own, or in an iterative manner that considers how mode networks plug into and affect the complete network.
A brief review follows of each mode network and its salient relationships to place context.
Pedestrian network
The pedestrian network — in this case meaning all public routes that accommodate pedestrians — is the largest network, combining thoroughfares and pedestrian-only facilities. Walking is the primal method of locomotion common to all human beings and is necessarily the most pervasive mode. Pedestrian routes are the most flexible and adaptive, and can range from narrow passages, to standard sidewalks, to broad plazas and promenades.
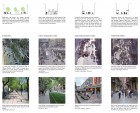
Gehl’s typology of pedestrian thoroughfares, from the public space plan for Sydney, Austrialia (2007) which is a leading example of pedestrian network planning. Image credit: Jan Gehl Architects
Gehl (1989) advocates the important concept of “pedestrian stays”: standing, sitting and lingering in order to participate in the activities of the public realm. Some examples of public realm activities might include chatting, people-watching, napping, joining an audience, games, sports, parades, performing, exhibits, commercial vending, nonprofit booths and presentations, demonstrating, and speechmaking. Pedestrian stays can be represented by the number of persons present and the duration of their stays, and is a way to measure the goodness of public spaces.
Pedestrian stays are usually considered a place function, not a network function. But there may be useful reasons to categorize them as a network function. They are part of roadside context; gatherings of people attract more people in a positive feedback loop; the presence of more pedestrians and cyclists decreases crash risk. Pedestrian trips can switch to pedestrian stays in an instant. Through travel is affected by pedestrian stays; linear, directed, through movement mixes with wandering, nondirected “place movement,” affecting the operation and space requirements of sidewalks and other pedestrian facilities. This is a topic that deserves more attention and research.
Bicycle Network
Bicycle facilities are often classified according to the safety requirements necessitated by motor vehicle traffic. They include bike boulevards, bike lanes, separated bike lanes, and bike trails. In the sustainable network there is a greater emphasis on livable thoroughfare and network design, which results in safer conditions for bicycling. When thoroughfare design is more livable, drivers receive more cues to slow down and be cautious. When more pedestrians and bikers are on the street, the risk of crashes is lessened — again, because drivers are cued to be cautious. In the sustainable network is it safer for bicycle and motor vehicle traffic to mix, and there is less need for separated bicycle facilities.
Private Vehicle Network
The spatial efficiency of private passenger-vehicle traffic is directly related to vehicle size and passengers per vehicle. Those factors are influenced by policies, market conditions and cultural patterns that are either outside or complementary to transportation network planning. Therefore, the sustainable network carefully specifies the speed and number of lanes of private-vehicle thoroughfares to ensure they are safe and comfortable for pedestrians and bicyclists. This framework is similar to the SmartCode and ITE/CNU frameworks. Many other guidebooks and case studies are available for the design of livable thoroughfares. In addition to those already mentioned, a few free online examples are the Urban Design Compendium, the Mobility and Community Form Tutorial, and Shared Space approaches. From sources such as these, rules of thumb may be developed for thoroughfares that serve motor vehicles:
- No thoroughfare has more than four lanes dedicated to private auto through traffic; thoroughfares generally are two-way.
- At least half of the right-of-way width is dedicated to pedestrian space, which includes sidewalks and public frontages, on-street parking, and (in the case of multi-way boulevards) very-slow-speed side lanes and medians between side and center lanes.
- Generally recommended target speed for vehicular traffic is 20-30 mph.
- Small blocks are the rule in all walkable areas (250-450 feet; may be shorter in carfree areas).
- Limited-access freeways and highways have no place in nonindustrial, built-up areas.
For project evaluation, the common “level of service” metric is intended to accommodate unlimited growth in private auto traffic, which is counterproductive in terms of sustainability, cost-benefit and long term functionality. It may be replaced with sustainability-oriented alternatives such as the “automobile trips generated” metric proposed by the San Francisco County Transportation Authority (2008).
These guidelines (and indeed the entire sustainable network concept) often provoke objections that congestion will be exacerbated and lengthy delays will appear, making vehicular travel excessively costly, inconvenient and inefficient. These objections are discussed in the “Congestion” section in Part Three of this essay.
Freight Network
Since freight does not carry passengers, the person-capacity metric does not apply. A volume-based metric may be a suitable alternative; for example, cubic feet per lane-equivalent per day.
Efforts to make freight movement more sustainable involve shifting from trailer-truck freight to rail and water modes, as well as smaller, more efficient freight vans and trucks. Some municipalities have experimented with providing more multimodal capacity and flexibility; terminals and warehouses in centralized locations outside of residential areas; policies for time-shifting to off-peak; and pooling resources for more efficient operations (e.g., city logistics). Congestion management and transportation demand management can reduce the costs of delay and make delivery times more reliable. The EU’s CITY FREIGHT project reviewed many of these strategies and found there was no universal solution; rather, various strategies worked best when chosen for and tailored to specific needs and applications.
Transit Network
Different types of transit have different spatial requirements and affect the design of thoroughfares in different way. Transit can be mixed with private motor vehicle traffic or separated in dedicated lanes. The separation can be strengthened with paving treatments, raised curbs, medians, and other barriers. Transit can be further separated from the thoroughfares by going underground or up above on elevated routes. Tunnels and elevated facilities can be extremely costly, and mass transit is the most efficient use of the limited space they have available. Sustainable networks will also prioritize the dedication of surface lanes to transit so that grade-separated facilities are less needed.
Green Network
Green networks do not serve much in the way of human transportation, other than bike paths and walking trails. But they are essential for environmental and human well being. Green networks in the sustainable network classification are nature preserves that furnish significant ecological services, including species protection, wildlife migration, aquifer protection and recharge, and air filtration and purification.
Sports fields, lawns, landscaping, industrial agriculture and the like are not part of green networks. They are important for recreational, agricultural or aesthetic purposes but do not provide the significant ecological functions. The interweaving of transportation networks and green networks can be a tricky balance; some guidelines are proposed in the City Scale section in Part Three of this essay.
Neighborhood Scale
The neighborhood scale primary relationship is based largely on the field of Space Syntax. Space Syntax is a type of network analysis that treats street networks in an abstract and mathematical way. It starts with the premise that the configuration of street routes — how streets are arranged in relation to each other — has psychological and social effects that influence the way cities function. Street route configuration affects the flow of pedestrians and vehicles, the location of activity centers, and other social phenomena.
Space Syntax tools measure things like: How many corners must be turned to get from one street segment to another? How many streets intersect with a given street segment? When traveling the shortest routes between various places, which street segments are traversed most often? In walkable urban environments where land uses are relatively free to develop according to demand, Space Syntax methods accurately model 60 to 80 percent of pedestrian traffic.
As a broad generality, one could say that Space Syntax measures network accessibility. Accessibility has many different meanings in the field of land and transportation planning. In this case, the definition of network accessibility is the ease with which one can travel from given thoroughfare segments to other thoroughfare segments.
The accessibility of thoroughfares is evaluated at a variety of scales. A thoroughfare segment may be highly accessible at the local scale, but not at the metropolitan scale. Or it may be highly accessible at several scales.

London network accessibility, evaluated at three different scales. Images courtesy Noah Raford, Space Syntax Limited
In addition to Space Syntax, a variety of methods can be used to evaluate network accessibility, including: standard GIS measures, such as pedestrian route directness, block size, and effective pedestrian shed; traffic demand modeling, including factors such as target speed, signal priority, land uses; and agent-based modeling, which simulates the actions and interactions of many individuals in a network. A combination of some or all of these methods will give a good picture of network accessibility.
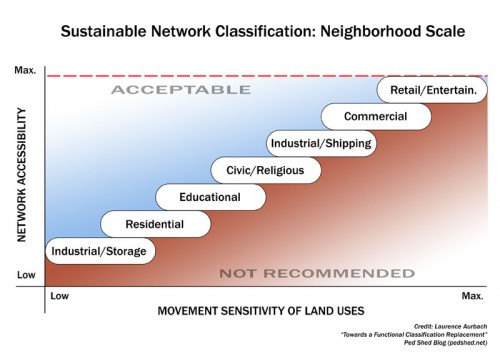
The primary relationship on the neighborhood scale: network accessibility to land use movement sensitivity. The land use movement sensitivity rankings shown are broad estimates only and have yet to be verified and refined.
Movement sensitivity is the degree to which a land use needs people traveling by for the purposes of user access, functionality, and visibility (Hillier 1996, 2008; Karimi et al. 2007). The chart above shows how land uses with higher movement sensitivity should be located on routes with higher network accessibility. All land uses require a minimum degree of network access to be viable or functional; some more than others. For instance, retail has the greatest movement sensitivity — it depends on high access to customers and high visibility to people passing by. So retail uses should be located on routes with highest accessibility.
Land uses with lower movement sensitivity don’t absolutely require high network accessibility. However
, it is perfectly acceptable and in some cases recommended for low-movement-sensitivity land uses to be located on high-accessibility routes — especially in the case of mixed-use streets. Those are where commercial, civic and residential uses are present on busy shopping streets. The “acceptable” area in the chart above indicates that it is acceptable for any land use to be located on a route that is more accessible than the minimum needed by that land use.
The “not recommended” area in the chart above indicates that land uses should not be located on thoroughfares that have less than the minimum needed accessibility. In other words, a land use should not be located on a thoroughfare that doesn’t provide sufficient passers-by for its needs.
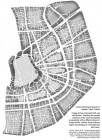
Plan for the redevelopment of Jeddah, Saudi Arabia. Credit: Kayvan Karimi et al. (2007) and Space Syntax Limited
An example of a plan that carries out this relationship is the redevelopment plan for Jeddah, Saudi Arabia. The image above shows nonresidential land uses (darker shades) concentrated along the most accessible thoroughfares. The areas with a high percentage of residential land tend towards the less accessible thoroughfares.
Advantages: This relationship provides a quick and easy rule of thumb for relating land uses and transport routes. It is the structural basis of viable pedestrian- and transit-oriented neighborhoods.
Disadvantages: There is no single, commonly accepted definition of network accessibility. Network accessibility itself can be a difficult concept to understand and explain.
Concluded in Part Three, which covers the City Scale relationship and the congestion-related impacts of a sustainable network.

The Muenster poster shows bicycles and vehicles stopped in the street, packed as tightly as possible — not vehicles in motion, which use much more space and use it very differently. Please see http://john-s-allen.com/blog/?p=7
John, I believe it is patently obvious that the Meunster photo, as well as the Tampa photo, shows parked vehicles. The purpose of the photos is simply to illustrate a point, which is the amount of street space occupied by the vehicles themselves.
The more interesting and relevant question is how the spatial efficiency of the different modes compares when the vehicles, bikes, or people are moving. The UITP graph above shows spatial efficiency as the number of people moving through one lane width (or equivalent) per hour. The graph indicates that private autos are by far the most spatially inefficient mode. I suspect, however, that the graph might refer to theoretical maximums. It would be very useful and interesting to see more empirical data, from both average conditions and best-practice, ideal conditions in various countries.
Pingback: Vem får ta plats i trafikmiljön? | Pitaya Organisationsutveckling
Pingback: Space - Cars vs. Bikes vs. Buses - hippy blog - aussie cycling in london | thehippy.net